
On the morning of Saturday 11th you may have seen �������� diving commentator Leon Taylor talking to Mishal Husain about Tom Daley's below par performance in the men's . During the discussion they played videos of two of Daley's dives with graphics added to describe the size of the splash and the angle of entry.
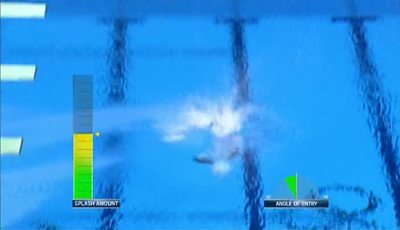
Graphics overlaid on footage of Tom Daley diving
The system producing this analysis has come out of , from which we also recently developed the . The analysis is automatic and works live - the system examines the video frame by frame to extract the diver and splash from the rest of the scene. It then measures the size of the splash and the angle the diver is making as he or she enters the water and displays the results to the viewer.
After developing a prototype (which inevitably became known as the "splashometer") we worked with our licensee, Red Bee Media, to develop a full product that could be sold around the world. They tested the system at the US Diving Trials earlier in the year and have been working with NBC during the Olympics to add the analysis to their diving coverage shown in the United States. It has even picked up some celebrity fans...
The Splashometer is getting a Workout! They might as well be doing Canonballs!!
— Samuel L. Jackson (@SamuelLJackson) August 10, 2012
The motivation behind this work was to help viewers to gain a better understanding of what differentiates a good dive from a bad one. In events such as diving where scores are awarded by judges it can sometimes be quite opaque to the normal viewer why one diver might score better than another. With tools such as this we aim to extract measures of performance that can be directly compared between different competitors. The simplest part of the dive where we can do this analysis is on the entry. Here the diver should enter the water as straight and as smoothly as possible. If he or she is off vertical then a lower score is given. Similarly, a large splash indicates that the entry to the water has not been smooth and the score drops accordingly.
Some viewers have been quick to point out that they can already see how big a splash might be, but the key development with this tool - as well as retaining on screen information about the blink-or-you'll-miss-it dive entry - is to move from a qualitative judgement ("that was a bad splash" or "he was off vertical there") towards an automatically generated quantitative judgement ("that splash scored 75% on the scale" or "he over rotated by 10 degrees"). Once you have a measure for performance you can start to use that information in interesting ways - perhaps use it to find which were the best or worst entries? Or to get a list of all the dives where the diver has over or under rotated. At its most simple it aids in comparisons, as in the �������� analysis where it shows the marked contrast between the two Daley dives.
Obviously these scores don't tell the whole story - the entry is only one aspect of the dive and the degree of difficulty makes a huge difference to the final score - that's why an expert like Leon Taylor is there to explain the complete dive and the nuances that a system like this can't hope to understand. For most viewers, experts like Leon are the best source of insights into an event but this offers them a tool to aid them with their work.
We're continually working on new developments so in the future we might be able to get measures for other aspects of the dive or apply the same idea to different events. Perhaps an automated dressage judge for 2020?
I'd like to thank Martin Nicholson for creating and developing the original system and the Red Bee Media Piero team for their work in turning it into a production ready system. They have also been .
-
�������� R&D - Intelligent Video Production Tools
�������� R&D - Use of 3-D techniques for virtual production
�������� R&D - Augmented Reality Athletics
�������� R&D - Image-based camera tracking for Athletics
�������� R&D - The Queen's Award winning Piero sports graphics system
�������� Internet Blog - �������� R&D wins Queen's Award for Enterprise for Piero
�������� R&D - Real-time camera tracking using sports pitch markings
-

Immersive and Interactive Content section
IIC section is a group of around 25 researchers, investigating ways of capturing and creating new kinds of audio-visual content, with a particular focus on immersion and interactivity.